Market Signals at a Crossroads: Reading Bitcoin's Next Move
Mid-2025 has brought Bitcoin to a fascinating inflection point. After the euphoria of touching new all-time highs above $110K earlier this year, the world's largest cryptocurrency settled into a consolidation phase that's testing both bulls and bears. However, in the past 24 hours it broke a new all-time high and potentially broke out of the consolidation phase. This happened just after I wrote this blog!
We're now over a year past the April 2024 halving, and Bitcoin's price action was painting a textbook compression pattern between $97K and $112K. Meanwhile, CNN's Fear & Greed Index (relating to US stocks) sat at 78—firmly in "Extreme Greed" territory—as summer trading gets underway. Does this suggest that stocks are overbought and poised to crash?
For crypto investors, this setup poses a critical question: Are we witnessing the calm before another breakout to new highs, or are these warning signs of a correction brewing? The answer may lie in understanding what the charts and sentiment indicators are really telling us.
None of this is investment advice—just a framework you can stress-test against your own risk tolerance and time-horizon.
1 | What the two pictures are telling us
| Image | What jumps out | Possible read-through |
|---|---|---|
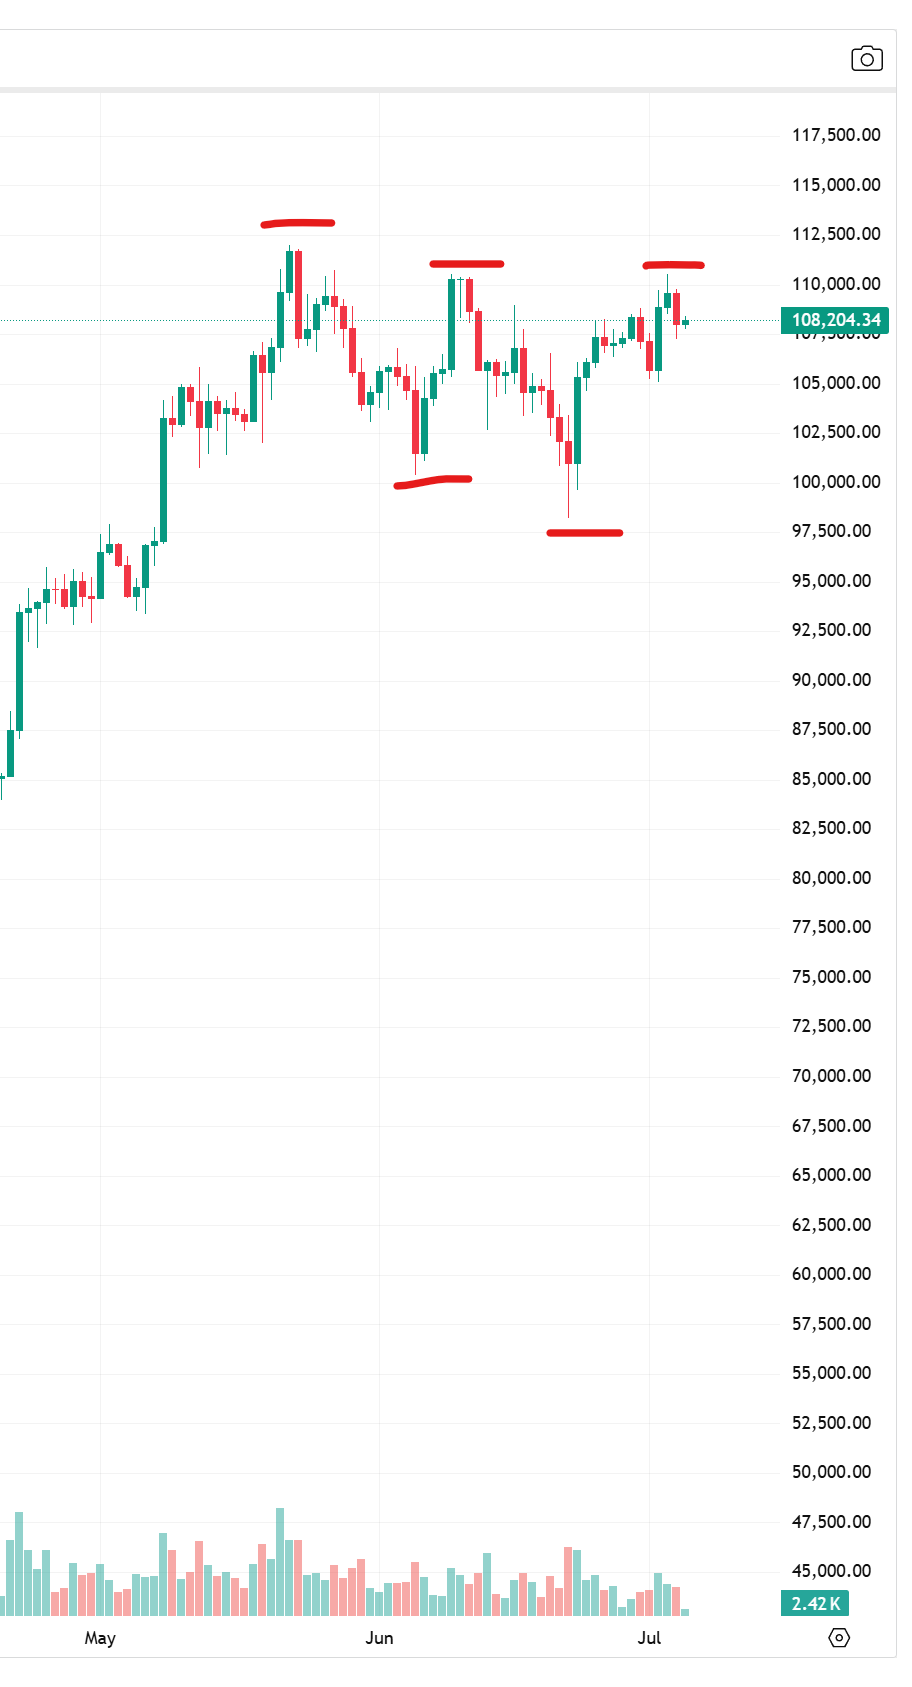
| BTC 2-month candle chart | • Three failed pushes into the ≈ $111-112 K area (red lines) • Two higher-volume washouts that stopped just under $100 K and ≈ $97 K • Volumes have tapered as the range has tightened |
A textbook compression box: horizontal resistance above, layered support below. Until price either clears $112 K or closes decisively below $97 K, it's "range rules": trade the edges or wait for confirmation. Some technicians call the pattern a potential double/triple-top, others a high-level consolidation; both are valid until the box breaks. |
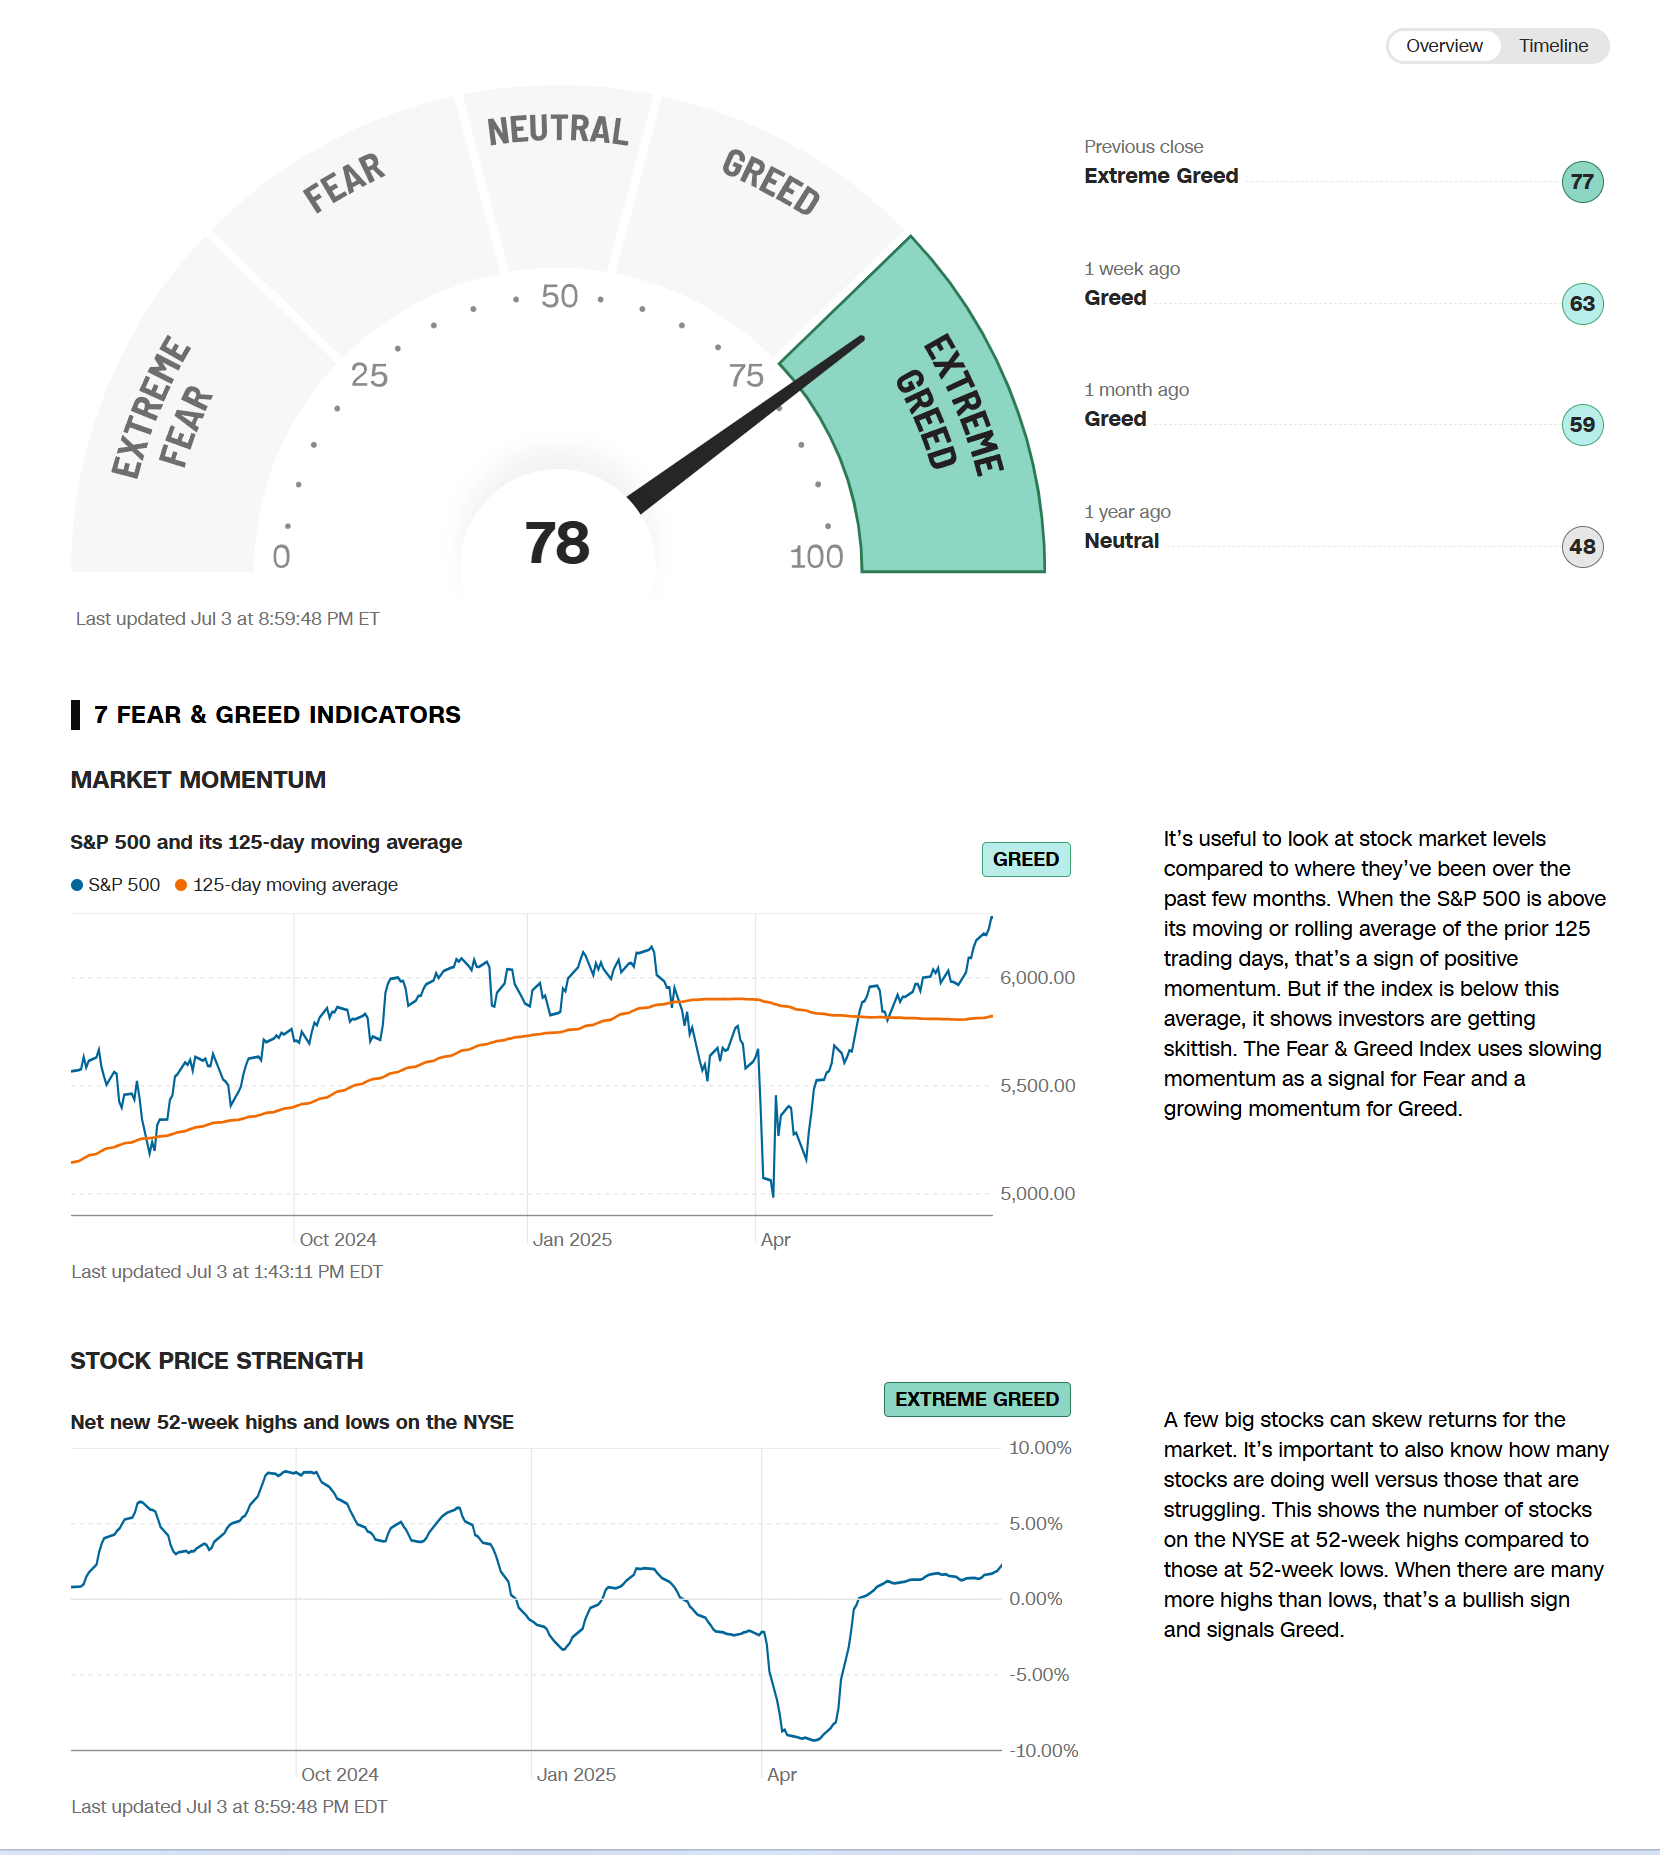
| CNN Fear & Greed gauge — reading 78 ("Extreme Greed") | The composite has climbed from 59 (one month ago) → 63 (one week ago) → 78. Sub-components such as 52-week-high breadth and price momentum are flashing "Greed/Extreme Greed." | Historically, readings > 75 tend to coincide with elevated—but not necessarily maximum—risk. Forward 1-month SPX returns after > 75 prints have been slightly negative on average since 2011, but outcomes are fat-tailed—bulls sometimes push further for weeks. |
2 | Does "Extreme Greed" cause crashes?
Not reliably. Peaks in 2013, late-2017, early-2020, and late-2021 did precede sharp drawdowns, but several other > 75 spikes (2017 Q1, 2019 Q4, mid-2023) were followed by nothing worse than a –5 % pullback.
The more consistent takeaway: sub-par forward returns when sentiment is euphoric, not an automatic crash trigger. Median 30-day SPX return after an > 75 close (2011-2024) ≈ –0.4 % vs +0.8 % for all periods.
Bottom line: "Extreme Greed" is a yellow light, not a stop sign.
3 | Bitcoin's place in the 4-year cycle
| Cycle landmark | Calendar date (this cycle) | Historic template | Where we are now |
|---|---|---|---|
| Halving | 19 Apr 2024 | New ATH 6-12 mo later, cycle peak ~ 18 mo later | We're ~ 14 mo post-halving; BTC has already posted an ATH north of $110 K—ahead of the old timetable. |
| Macro backdrop | Spot-BTC ETFs, sovereign-wealth allocations | More institutional capital dampens volatility, extends cycles | Flows into U.S. spot ETFs (~ $15 B YTD) may be cushioning dips and muting the old boom/bust rhythm. |
Key implication: the classic 4-year script is softening; price levels and liquidity matter more than a calendar stopwatch.
4 | The Fed and broader liquidity
Rates. The dot-plot projects three 25 bp cuts in 2025. Futures now lean toward September/October/December as the most likely windows, but strong payrolls have pushed the first-cut odds into Q4.
Risk-asset playbook:
- Status quo (no cut yet, no hike): Tight but predictable liquidity → often a slow, "wall-of-worry" grind higher.
- Earlier cuts because growth rolls over: Bond-friendly, equity-mixed (earnings revisions may dominate).
- Surprise hikes because inflation re-accelerates: Valuations get hit; highest-beta assets (crypto, growth stocks) usually feel it first.
5 | Putting the puzzle pieces together
| Scenario | What would confirm it | Risk-management thought |
|---|---|---|
| Breakout & melt-up | BTC weekly close > $112 K and Fear & Greed stays > 75 with no VIX spike; Fed sticks to gradual-cuts script | Trailing stops or partial profit-taking as price extends; watch on-chain realized–price gap for overheating |
| Range-bound grind | BTC keeps bouncing $97–112 K; Fear & Greed chops 60–80; Fed stays on hold | Theta-positive tactics (selling calls/puts), accumulate on dips, stay nimble |
| Correction / mini-crash | BTC closes < $97 K **or** SPX > 5 % drop while F&G > 70 shifts < 50; surprise inflation print reignites hike talk | Keep dry powder; hedge via puts or inverse ETFs; track crypto ETF flows for outflow spikes |
Practical take-aways
- "Extreme Greed" ≠ immediate doom, but it does argue for tighter risk controls; the forward-return distribution worsens at these sentiment levels.
- Watch the box, not the calendar: BTC above $112 K is fresh price discovery; below ~$97 K opens air pockets to $88–85 K and even the mid-70s swing low.
- Macro catalysts still count: A benign glide-path to lower Fed funds underpins the bull case; a policy-error or inflation resurgence would be the fastest way to flip the script.
- Cycle lore is fading: Institutional flows and ETF demand mean the old 4-year halving "clock" is now just one variable among many.
Stay flexible, size positions to volatility, and let the market confirm (or refute) any narrative before making big bets. Good luck out there!